Affiliate links may be included for your convenience. View our privacy and affiliates policy for details.
Make a garden pictograph with your kids to track when you water the garden, how your plants grow, and more. Thanks to Education.com for this great idea!
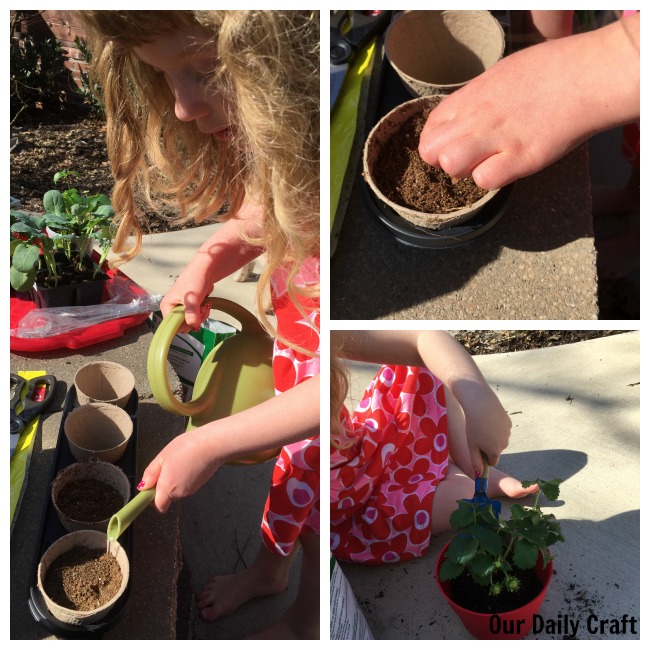
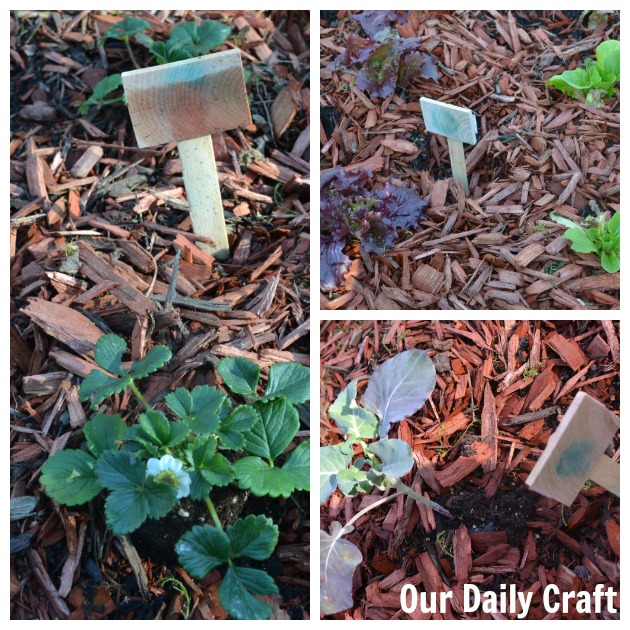
The girl loves to garden and observe the plants and creatures in the garden. We’re so ready to get going on the garden for the year, but it’s not quite time; we keep getting cold snaps after two or three false springs!
But we’re getting ready by talking about plants and what we’d like to grow this year. I’ve been stalking seed companies online and fretting that I should have started my tomatoes already.
This fun garden pictograph idea is a great way to start the season and to keep your kids interested in the garden all season long.
Help your child enhance math skills with this ongoing graphing project. The growing garden pictograph is a fun, simple way to learn about the scientific method, discover nature and explore counting concepts all while creating a unique work of art.
If you do not have an established garden, you can still try this activity with your child. Start a small garden in your yard, a container garden, butterfly garden, or even grow a single plant indoors. You can even pay some visits to a community garden and observe the plants there.![]()
What You Need
- Garden or plant
- Poster board or paper
- Markers
- Ruler or straight edge
What You Do
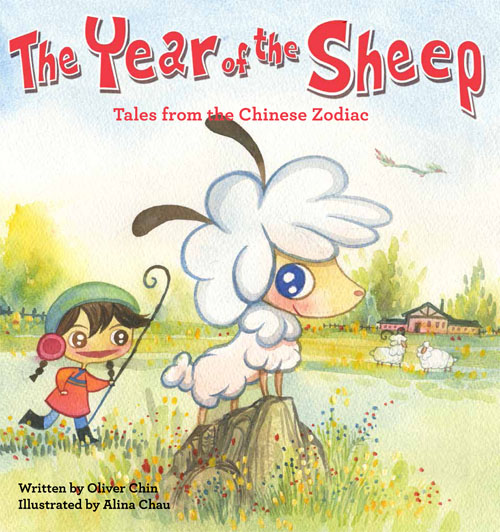
- Discuss gardens and the growing cycle with your child. It may be helpful to read a picture or non-fiction book about plants and gardening.
- Choose at least one plant to grow with your child. Let them pick (with some guidance from you). Depending on your region/climate, time of year, and availability of growing space, you may want to limit the plant selection. Also, you can decide if you would like to grow from seed or not.
- Help your child to plant their choice in the garden (or container).
- Using a dark marker and a straight edge, help your child to create a graph on the poster board. Make each cell in the graph large enough to fit a picture inside.
- Choose what you want the rows and columns to represent. Some examples are weather, temperature, plant size, season or times watered.
- Watch the plant(s) grow! Ask your child to fill in the cells with pictures that represent what you are measuring. For plant size, have him observe how the small plant gets bigger, then try to draw what he sees. For weather, you can have him draw a sun, clouds, or a rain drop. You could also use a rain gauge to track how much rain you’ve received, or measure the plants and write down how tall they are or how long the vines have gotten.
At the end of the growing season, look at the pictograph as a whole. Ask your child to create a conclusion based on what he has graphed. This should involve counting the pictures. Questions to discuss might include, “How many times did it rain?” and “Did this affect how big the plant grew?” At the end of this project, your child will have a better understanding of graphing and plant life cycles, and will have spent the season observing and enjoying nature.
Thanks to Education.com for sharing this fun activity! Check out their sunny day activities and more math activities for little kids.


1 Comment
Hello,
I like this post, You shared very important points with us… I like your efforts.
Thanks for your share!